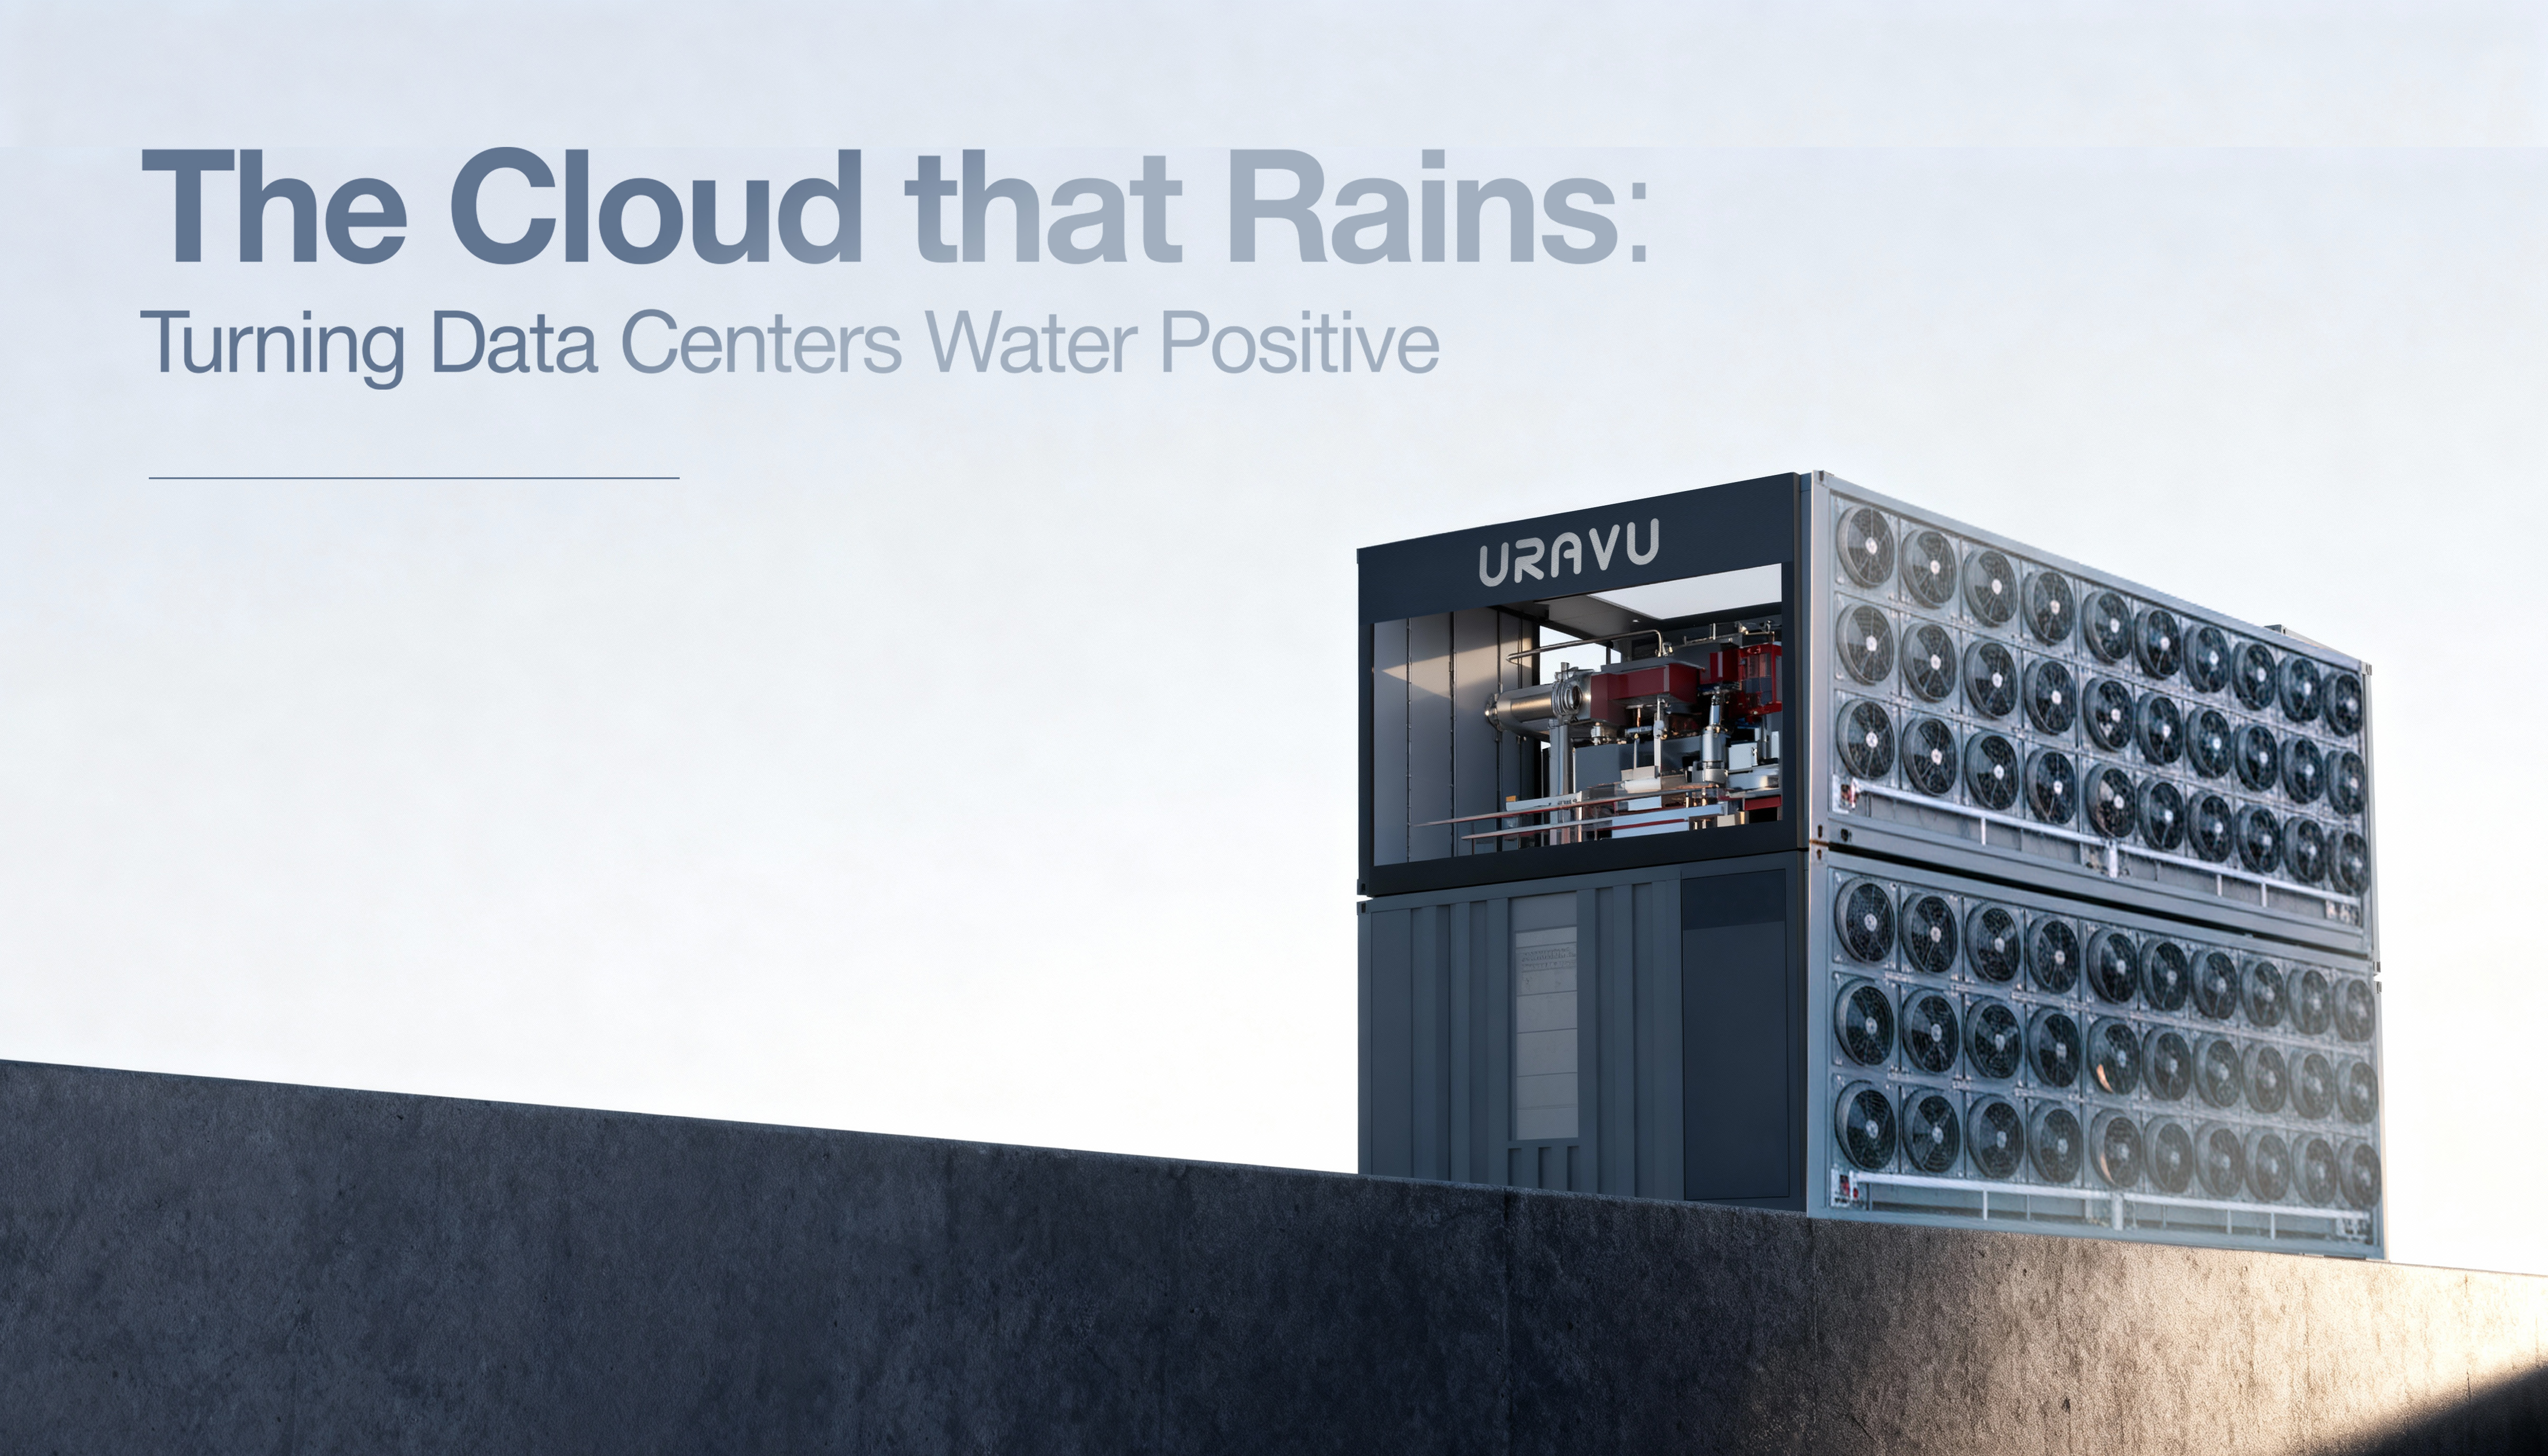
The Cloud that Rains: Turning Data Centers Water Positive
A white paper by Uravu Labs | Authors - Swapnil Shrivastav, Dr. Rishabh Srivastava
Transforming data center waste heat into fresh water while cutting cooling costs
Executive Summary
The global data center industry faces a paradox: digital "clouds" promising limitless computing are hitting real limits-water scarcity and rising energy costs. According to the IEA, data centers consumed 300-360 TWh of electricity globally in 2022 (1.5% of global demand), projected to exceed 1,000 TWh by 2030 (~4% of demand), driven by AI workloads and cloud expansion. Leading hyperscale operators have achieved remarkable cooling efficiency improvements, with Google reporting an average PUE of 1.10 and Microsoft achieving 1.12 in 2023, yet cooling still represents 25-35% of non-IT energy in optimized facilities and 35-50% industry-wide where average PUE remains 1.5-1.7. Meanwhile, research in Nature Water (2023) estimates U.S. data centers withdrew 1.7 billion cubic meters of water in 2021 for cooling, with facilities in water-stressed regions consuming 20-50 million liters annually per megawatt.
Cooling data centers is a delicate balance between managing energy and water. Yet in our rush to build digital infrastructure, we rarely pause to ask: what if the solution isn't about choosing between resources, but about reimagining how they flow through our systems?
Uravu Labs, a Bengaluru based startup, has developed a solution that inverts the current paradigm. Using proprietary liquid desiccant technology, Uravu's solution harvests atmospheric water using low-grade waste heat (30-60°C) from data center operations-the same heat that would otherwise be rejected. The result: data centers become water producers instead of water consumers, achieving negative Water Usage Effectiveness (WUE) while reducing cooling energy consumption by 10-80%+ and delivering massive cooling cost savings.
This paper explores the global potential of this approach, demonstrating how waste heat from projected gigawatts of data center capacity could produce billions of liters of fresh water annually while cutting cooling costs by 5-60% depending on climate and integration mode.
1. The Paradox of the Cloud
When we speak of "the cloud," we invoke an image of something ethereal and limitless. Yet behind every search query, AI model, and streaming video lies a massive physical infrastructure of servers, networking equipment, and cooling systems-infrastructure that is increasingly constrained by two fundamental resources: energy and water.
The data center industry is at an inflection point:
- Explosive growth: Synergy Research Group projects that hyperscale data center capacity alone will grow at a CAGR of 15-20% through 2030, while McKinsey estimates total global data center power demand could reach 35-40 GW by decade's end, with AI workloads accounting for 25-30% of new capacity additions
- Energy intensity: Data centers already consume 1.5% of global electricity, a figure expected to reach ~4% by 2030
- Water stress collision: Many of the world's largest data center hubs-Northern Virginia, Phoenix, Amsterdam, Singapore, Mumbai-sit in regions facing water scarcity or regulatory pressure on water use
- Cooling dominance: Cooling systems account for up to 40% of data center energy consumption and the vast majority of water consumption in facilities using evaporative cooling
2. The Dual Crisis: Energy & Water in Data Centers
2.1 The Energy Challenge
Modern data centers operate under intense pressure to improve Power Usage Effectiveness (PUE), the ratio of total facility energy to IT equipment energy. While industry leaders have achieved PUE values approaching 1.1, cooling remains the largest non-IT energy consumer.
Cooling energy breakdown by approach:
At current electricity costs ($0.08-0.2/kWh in most markets), cooling a 10 MW data center costs $2.8-7.9 million annually. Each 0.1 reduction in PUE translates to approximately $700,000 in annual savings for a 10 MW facility.
2.2 The Water Challenge
The water intensity of data centers has drawn increasing scrutiny:
- Google's data centers consumed 15.8 billion liters of water in 2022
- Microsoft's water consumption rose 34% between 2021 and 2022, reaching 6.4 billion liters
- A typical 1 MW data center using evaporative cooling consumes 25-50 million liters of water annually
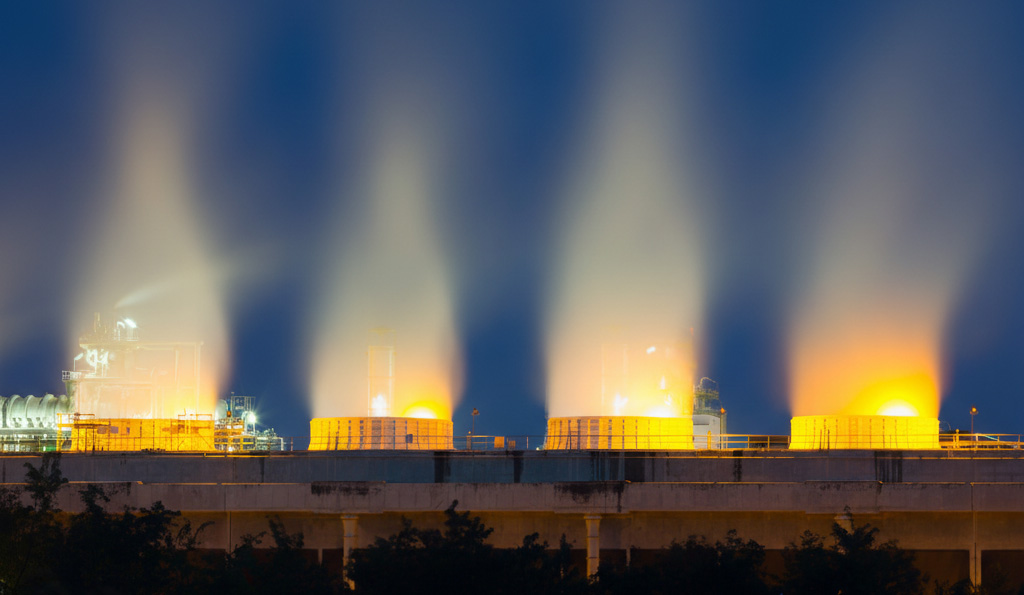
2.3 The Heat Rejection Problem
Every watt of IT power generates heat that must be rejected. Current approaches include:
- Air-cooled chillers: Energy-intensive, especially in hot climates
- Evaporative cooling towers: Water-intensive
- Liquid cooling: Efficient but still requires heat rejection to ambient
- Free cooling: Climate-dependent, limited availability
All of these approaches treat waste heat as a problem to be eliminated. Uravu's approach treats waste heat as a resource to be harvested.
2.3.1 Waste Heat Reuse: Geographic and Infrastructure Constraints
District heating systems that repurpose data center waste heat have gained attention in Northern European markets, but face significant geographic and seasonal limitations. This approach requires proximity to existing district heating infrastructure, sustained cold climates, and is completely non-viable in tropical and hot regions like Singapore, Mumbai, Phoenix, and Dubai-where 60%+ of global data center capacity is being deployed. This highlights the need for alternative waste heat utilization pathways that can operate year-round across diverse climates.
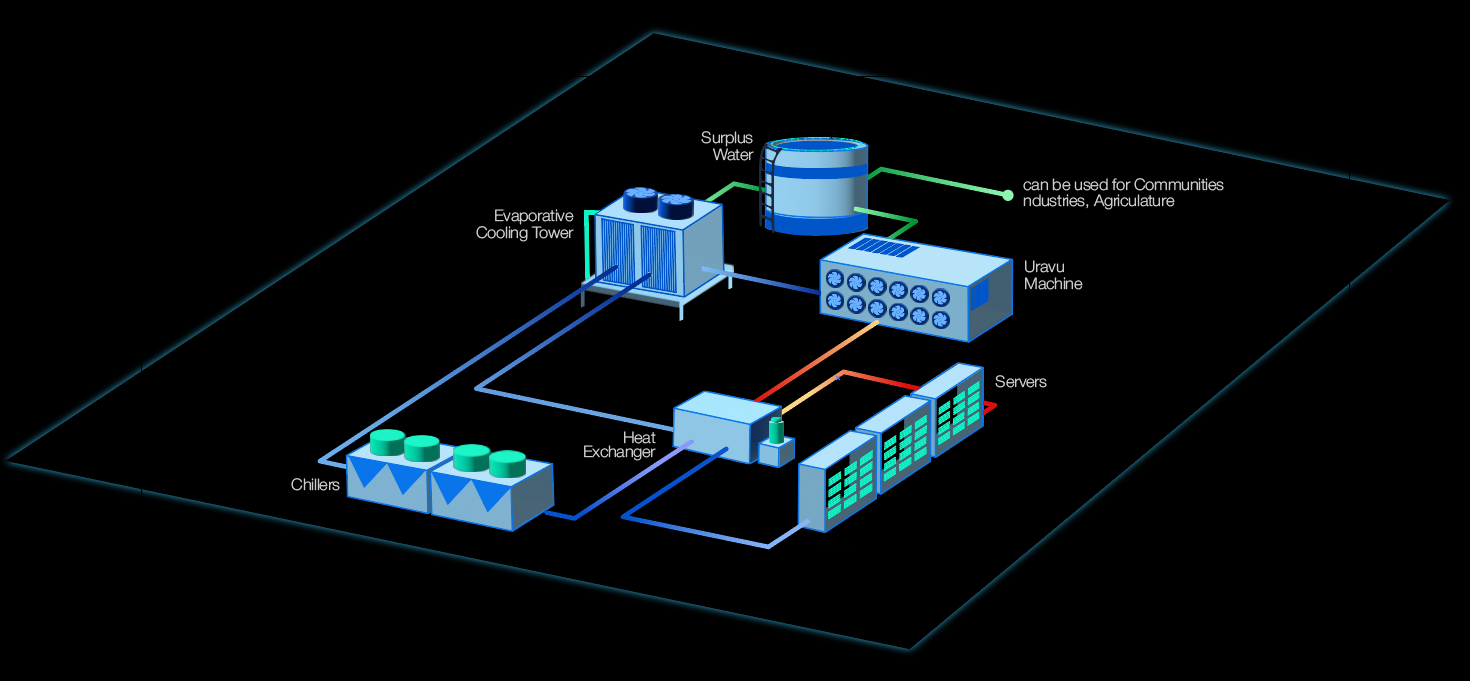
3. The Uravu Solution: Turning Waste Heat into Fresh Water
Uravu's solution inverts the dual crisis of energy and water. By capturing waste heat, the system generates atmospheric water while reducing cooling load by up to 80%. This reduces energy requirements for cooling and transforms data centers into water-positive infrastructure.
The technology leverages proprietary liquid desiccant chemistry that operates efficiently across diverse climate conditions-from hot-humid tropics to temperate zones-making it deployable in the world's major data center hubs regardless of geographic location.
Unlike conventional atmospheric water generation systems that require energy-intensive refrigeration, Uravu's approach uses thermal energy that data centers already produce and must reject. This fundamental difference in thermodynamic approach delivers superior economics: the system pays for itself through cooling cost savings alone, with water production as an additional benefit rather than the primary cost driver.
The solution is designed for flexible integration with existing and next-generation cooling infrastructure-from traditional chilled water systems to advanced liquid and immersion cooling-making it viable for both retrofit and new build applications.
3.1 Technology Overview
Uravu's atmospheric water generation (AWG) system is built on advanced and proprietary liquid desiccant technology that extracts water from ambient air using data center waste heat as the primary energy input.
How it works:
- Absorption: Ambient air passes through a proprietary liquid desiccant solution that captures water vapor with extremely high efficiency across humidity ranges (20-90% RH)
- Heat integration: Diluted desiccant is heated using 30-60°C waste heat from data center cooling loops-heat that would otherwise be rejected via cooling towers, dry coolers or chillers
- Desorption: Under controlled partial vacuum, water is separated from the desiccant, condensed, and purified to drinking water standards
- Regeneration: Concentrated desiccant returns to the absorption cycle, creating a closed loop
- Cooling integration: The desorption process requires heat to drive evaporation and generate water vapor. Data center waste heat provides this energy while simultaneously being cooled, reducing the demand on chillers
3.2 Performance Characteristics
3.3 Modular, Scalable Units: From 0.5 MW to Multi-Gigawatt Deployments
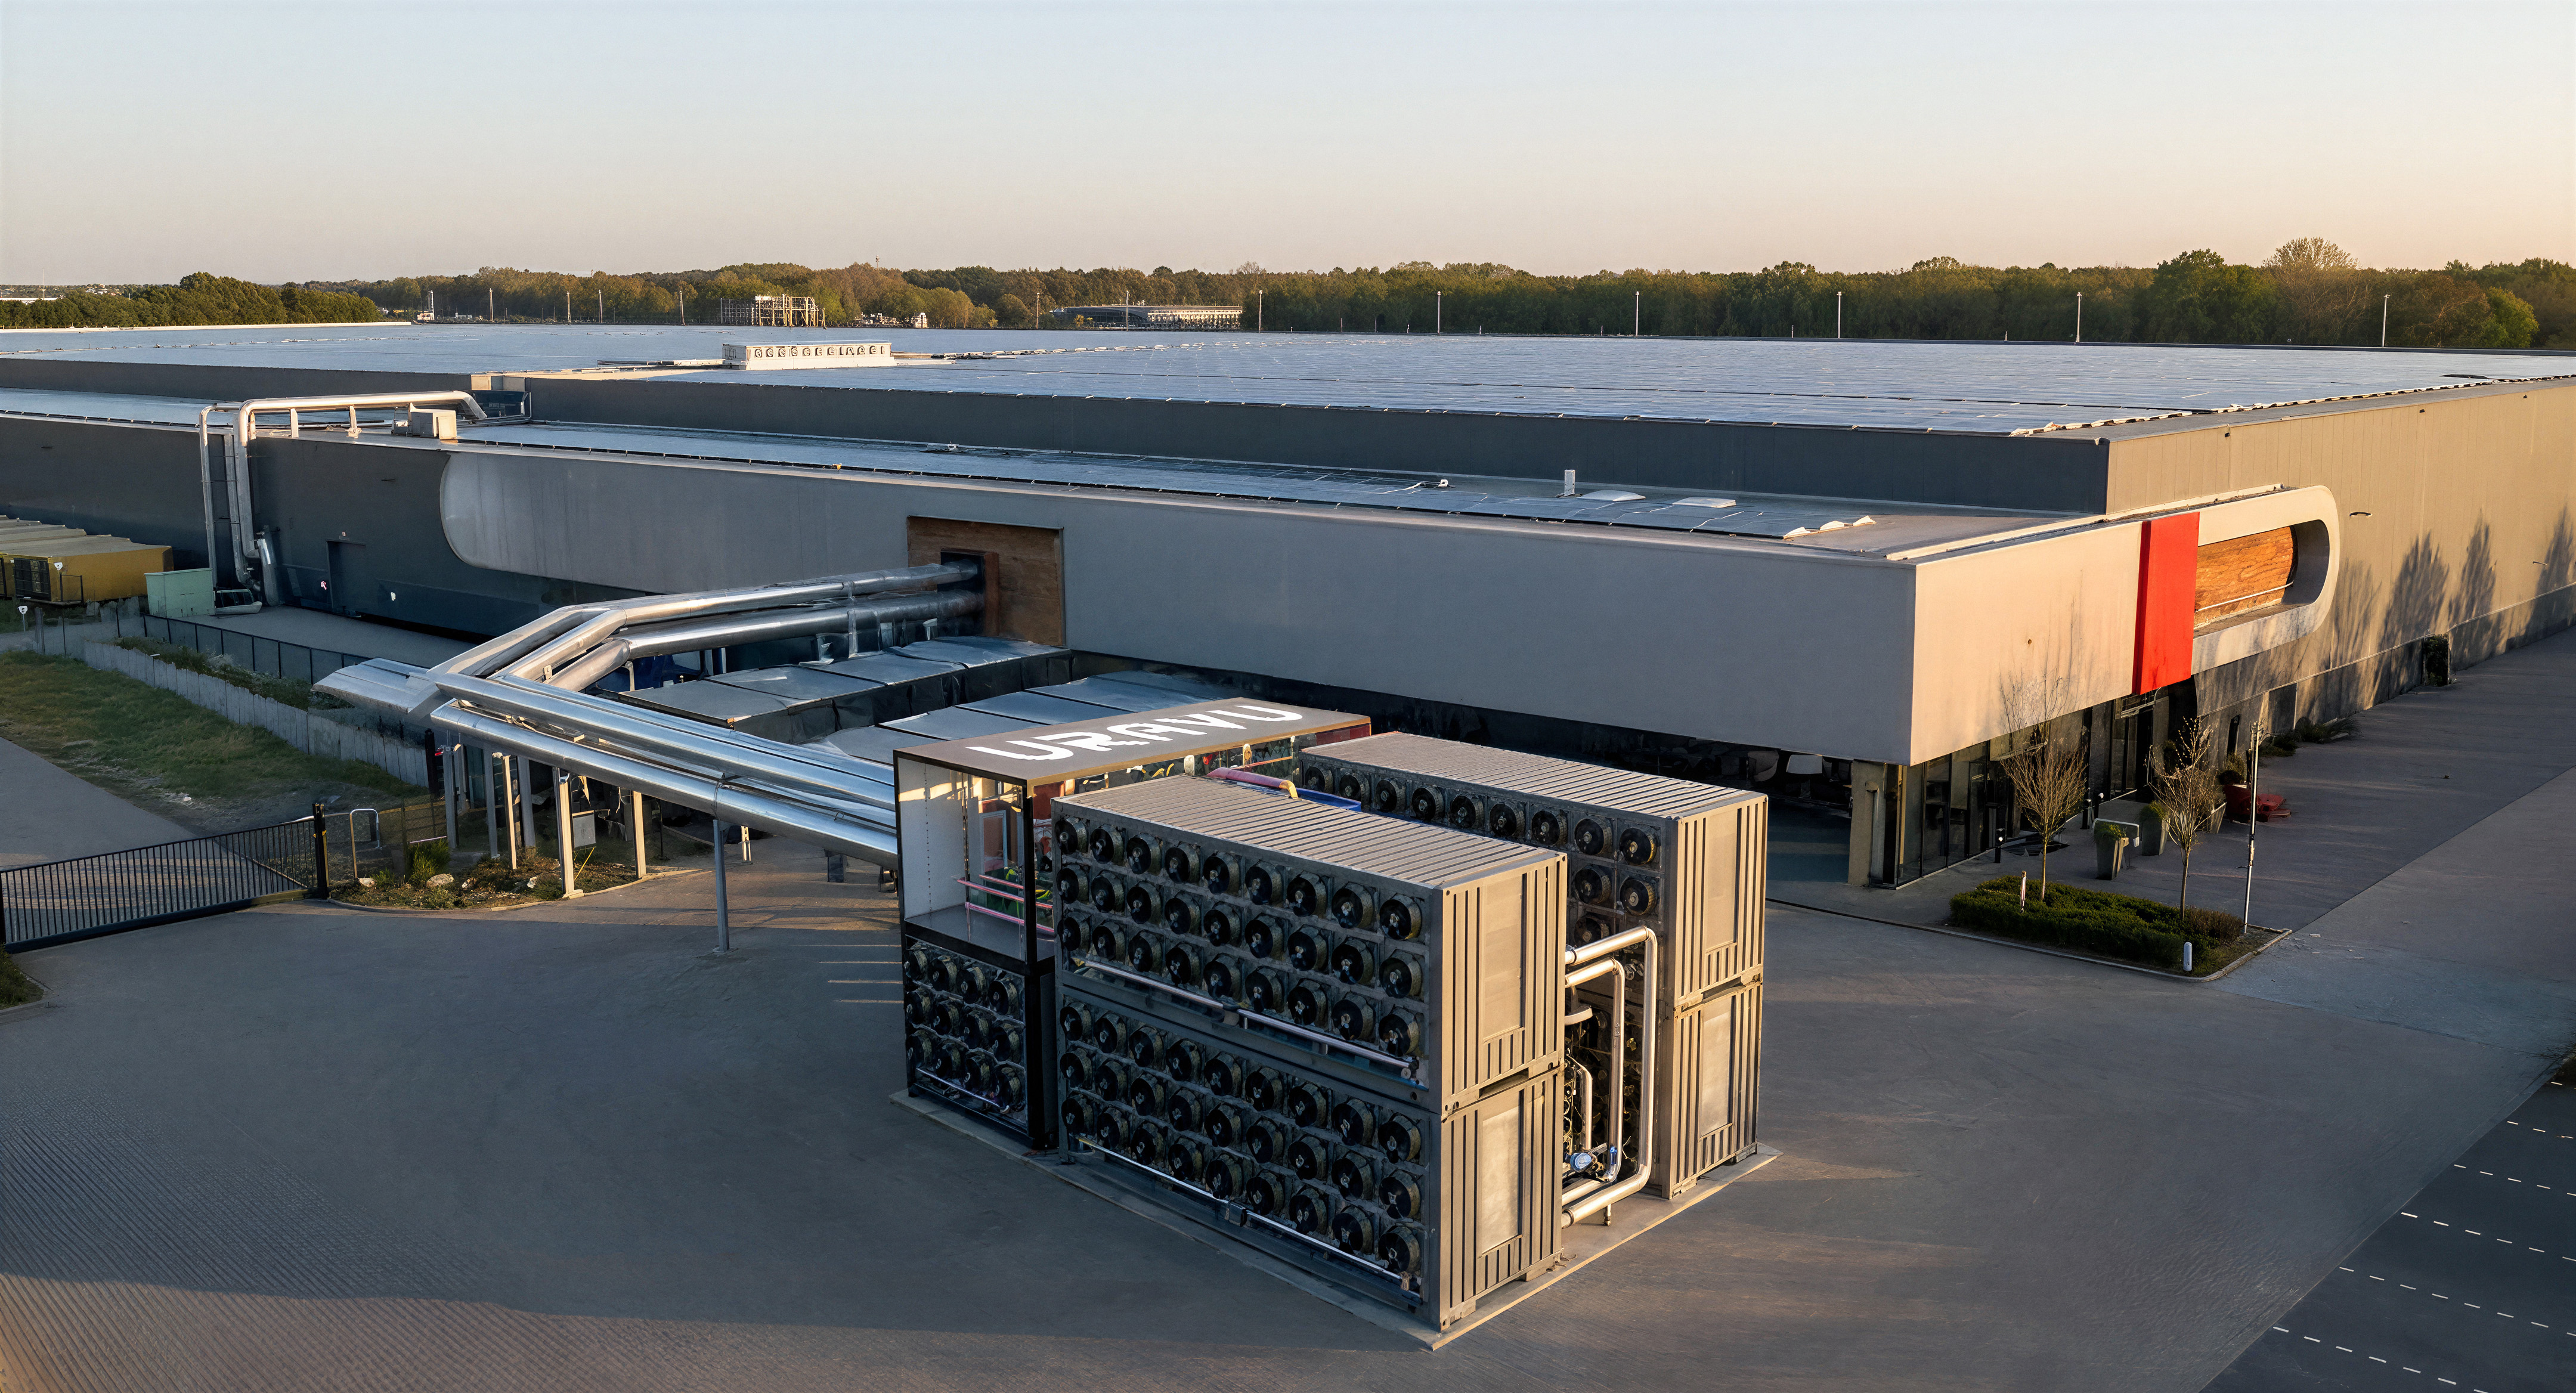
The Uravu system is designed for plug-and-play integration with data centers through a fully modular, containerized architecture. Each module is engineered to fit inside standard 20-ft and 40-ft shipping containers, allowing units to be stacked and scaled based on cooling and water-generation needs. This accelerates deployment, eliminates site-level construction complexity, and enables rapid capacity expansion as loads increase.
Integration requires only a heat exchanger connection and a compact piping loop. All instrumentation is pre-installed within the container modules for seamless automation and real-time performance control. With the absorber, desorber, desiccant–facility water heat exchanger, and condenser packaged within the container footprint, Uravu delivers a full thermal solution while occupying less than 60 m² per module for a 1 MW cooling load.
3.3.1 Modular Redundancy and Reliability Architecture
The containerized, modular design of Uravu systems enables flexible redundancy configurations that align with data center reliability standards:
- N+1 Configuration: One additional module beyond base capacity. If one unit fails, remaining modules maintain full capacity.
- N+2 Configuration: Two redundant modules allow simultaneous maintenance or failure while maintaining operations.
- 2N Configuration: Double capacity across two independent systems. Complete system-level redundancy for Tier IV facilities requiring zero downtime.
- Distributed Redundancy: Modules across different physical locations eliminate single points of failure.
Each module operates independently, enabling seamless failover. This delivers carrier-grade reliability with flexible redundancy scaling.
3.4 Integration Modes
Uravu systems are flexible and can integrate with data center infrastructure in multiple configurations:
3.5 Integration with Next-Generation Cooling Technologies
As data centers evolve toward higher density computing-particularly for AI and HPC workloads-liquid and immersion cooling are becoming essential. Uravu's technology is uniquely positioned to complement these advanced cooling approaches.
Liquid cooling integration:
Modern liquid cooling systems (direct-to-chip cold plates, rear-door heat exchangers) operate at elevated temperatures (40-60°C), making them ideal heat sources for Uravu's AWG technology. This creates a symbiotic relationship:
- High-temperature liquid cooling loops deliver optimal thermal energy for desiccant regeneration
- Uravu absorbs waste heat that would otherwise require energy-intensive rejection via chillers or dry coolers
- Reduced heat rejection infrastructure: Smaller or eliminated cooling towers, reduced chiller capacity
- Improved PUE: Combined liquid cooling + Uravu systems achieve PUE of 1.03-1.08
Integration with immersion cooling:
Two-phase immersion cooling systems (using dielectric fluids) also generate concentrated heat at temperatures ideal for Uravu integration (45-55°C). Benefits include:
- Direct coupling to immersion cooling condensers
- Elimination of separate heat rejection systems
- Water production from the most energy-dense computing environments
- Ideal for edge AI deployments where both cooling efficiency and water independence are critical
4. Global Economics: Water Production, Cooling Savings, and Deployment Potential
Uravu's AWG technology is designed to integrate seamlessly with modern data center cooling architectures, particularly those optimized for high-density AI and HPC workloads. The system's thermal performance is calibrated to work efficiently with industry-standard coolant temperature ranges that are becoming universal across hyperscale deployments.
Note - All performance metrics and economic analyses throughout this white paper are based on the 28°C supply and 40°C return coolant temperature range, which is rapidly becoming the industry-standard thermal operating conditions for modern data center cooling systems.
4.1 Performance Across Climate Zones and Operating Conditions
Uravu’s technology is engineered to deliver consistent performance across a wide range of climatic conditions, with water generation and cooling efficiency mapped against temperature and humidity bins. The table below illustrates the performance of the Uravu unit when operated using data center waste heat across different climate zones.
Climate zone performance:
*Net Water Production - Net water production is the amount of water delivered after fulfilling all the necessary cooling demands of the Uravu unit and the data center.
4.2 Lighthouse Analysis: 8 Target Locations
We analyzed data center hubs globally, prioritizing locations with high water stress, favorable climate for waste heat utilization, and significant planned capacity growth.
Priority lighthouse locations:
Integrating the Uravu modular unit into the cooling infrastructure at the targeted temps significantly lowers both the chiller cooling demand (~10 to 100%) and the overall Levelized Cost of Cooling (LCOC) when compared to a conventional dry-cooler-plus-chiller setup. In high-temperature locations such as Singapore and Phoenix, this architecture delivers substantial economic benefits, reducing LCOC by approximately 34–55%. Even in colder regions, such as Frankfurt, the system continues to offer meaningful improvements, achieving roughly 15% reduction in LCOC.
4.3 Global Market Context
By 2030, global data center capacity is projected to exceed 160 GW across major hubs, with over 60% concentrated in water-stressed regions including Phoenix, Northern Virginia, Singapore, Mumbai, Dubai, and Amsterdam. The United States leads with Northern Virginia alone representing 30% of worldwide capacity, while Asia-Pacific markets show the fastest growth driven by China and India's digital expansion.
Sources: Cushman & Wakefield Global Data Center Market Comparison 2025, JLL Global Data Center Outlook 2025, Goldman Sachs Research, Synergy Research Group, Mordor Intelligence Northern Virginia Data Center Market Analysis[1][2][3][4][5]
4.3.1 Global Potential: GW-Scale Projections
Extrapolating to 2030 projected data center capacity:
Conservative scenario (50% adoption on 160 GW capacity):
- Addressable capacity: 80 GW
- Annual water production: ~798 billion liters
- Annual cooling cost savings: ~$5 billion
- Water equivalent: Enough for ~14.6 million people annually (@ 150L/person/day)
Aggressive scenario (75% adoption on 160 GW capacity):
- Addressable capacity: 120 GW
- Annual water production: ~1197 billion liters
- Annual cooling cost savings: ~$ 9 billion
- Water equivalent: Enough for ~21.8 million people annually (@ 150L/person/day)
5. Environmental Impact: Carbon & Water Savings at Scale
5.1 Carbon Emission Reductions
Cooling energy reduction from Uravu’s solution directly translates to carbon emission reductions. Using global average grid carbon intensity:
Per MW of data center capacity annually:
- Cooling energy reduced: 400-1100 MWh/year
- CO₂ avoided: 100-700 tonnes/MW/year (depending on grid mix)
At scale (80 GW conservative scenario):
- Annual CO₂ reduction: 15-20 million tonnes
- Equivalent to: 3.3 to 4.3 million cars removed from roads
- Or: 35-46 million barrels of oil not consumed
In markets with coal-heavy grids (India, parts of China, Southeast Asia), the carbon impact is even more substantial, with potential reductions of 600-800 tonnes CO₂ per MW annually.
5.2 Water Resource Impact
Direct water production:
As calculated above, conservative adoption yields ~798 billion liters of fresh water annually by 2030.
Beyond direct water consumption - understanding Scope 2 water footprint:
While this analysis focuses on the water-positive impact of atmospheric water generation, it's important to recognize that data centers' total water footprint extends beyond their direct cooling needs. The electricity consumed by data centers for cooling also has an associated water footprint from power generation - known as Scope 2 water impact - which Uravu's solution addresses through cooling energy reduction.
5.2.1 Scope 2 water footprint reduction
When data centers measure their water footprint, they typically only account for direct water consumption (Scope 1) - water used in cooling towers and facilities. However, the Scope 2 water footprint - the water consumed to generate the electricity powering the cooling systems of data center - is often 5-30% larger than direct water use.
Scope 2 Water Footprint: The Hidden Water Cost of Energy
According to research from Virginia Tech and Lawrence Berkeley National Laboratory, electricity generation has significant water intensity:
- Coal power plants: 2,000-2,500 liters per MWh (thermoelectric cooling)
- Natural gas combined cycle: 750-950 liters per MWh
- Nuclear power: 2,400-2,800 liters per MWh
- Grid average (US): ~1,900 liters per MWh
How Uravu Reduces Scope 2 Water Footprint
Uravu reduces Scope 2 water footprint through cooling energy reduction:
Cooling energy reduction per MW:
- 400-1100 MWh/year eliminated
Scope 2 water footprint reduction per MW:
- At US grid average (1,900 L/MWh): 665,000 - 2.09 million liters/year avoided
- At coal-heavy grids (2,500 L/MWh): 875,000 - 2.75 million liters/year avoided
Percentage reduction in total water footprint:
For a 10 MW facility with air-cooled chiller + dry cooler baseline (no evaporative cooling):
Baseline water footprint:
- Scope 1 (direct water use): 0 liters (air-cooled system)
- Scope 2 (electricity generation): ~66.5 million liters/year (at US grid average)
- Total baseline: ~66.5 million liters/year
With Uravu integration:
- Scope 2 reduction: 6.65-20.9 million liters (from cooling energy savings)
- Water production: 60-100 million liters (from atmospheric generation)
- Net Scope 2 impact: (Baseline - Scope 2 Reduction) - Water production = Remaining footprint - Water produced
= (66.5 - 6.65 to 20.9) - (60-100) = 45.6 to 59.85 - (60-100) = -0.15 to -54.4 million liters
(Negative value indicates net water positive - more water produced than consumed)
Net positive water contribution to community: +0.15 to +54.4 million liters/year
5.3 Circular Economy Benefits
Beyond carbon and water metrics, the Uravu approach embodies circular economy principles:
- Waste heat valorization: Converting a liability (rejected heat) into productive use
- Atmospheric water harvesting: No groundwater extraction, no competition with agriculture or municipalities
- On-site production: Eliminating transport energy and infrastructure for water delivery
- Quality co-benefit: Uravu-produced water meets or exceeds drinking water standards, with potential for on-site use in facilities, landscaping, or community access
- Water utility integration: Net positive water production can be fed back into municipal systems, providing decentralized water sources that enhance grid resilience
- Community water security: Surplus water transforms data centers from resource competitors into community providers-particularly valuable in regions with declining groundwater tables
- Aquifer recharge programs: Excess water can restore depleted groundwater basins through managed aquifer recharge systems-particularly impactful in regions like Phoenix, Bangalore, and Northern China where tables are dropping 2-4 meters annually
6. Conclusion: Building the Regenerative Cloud
The data center industry stands at a crossroads. Explosive growth in AI, cloud computing, and digital services is colliding with planetary boundaries-water scarcity, energy constraints, and carbon budgets. Business-as-usual approaches to cooling will not scale.
Uravu's water-positive solution represents a fundamentally different paradigm:
✓ Economic: Reducing operating costs while improving resilience
✓ Environmental: Cutting carbon emissions and producing fresh water
✓ Strategic: Transforming data centers from resource consumers to community assets
✓ Scalable: Technology ready for GW-scale deployment with massive global potential
The transition to water-positive data centers is not just environmentally necessary-it is economically compelling and technically proven.
Next Steps for Data Center Stakeholders
Get your site evaluated by Uravu:
- Request a comprehensive site assessment to quantify water production potential
- Receive detailed modeling of cooling cost savings and ROI for your facility
- Understand carbon reduction impact and ESG benefits specific to your operations
- Get customized integration recommendations based on your infrastructure
Evaluate Uravu integration:
- Characterize waste heat availability (temperature, flow rate, duty cycle)
- Model economics for your specific climate, electricity costs, and facility design
- Review technical specifications and space requirements
Identify pilot opportunities:
- Start with 1-5 MW proof-of-concept deployment
- Select facilities in water-stressed regions for maximum impact
- Establish baseline metrics for water production, energy savings, and cost reduction
- Plan phased rollout to additional facilities based on pilot results
Engage with stakeholders:
- Communicate water-positive goals to investors, customers, regulators
- Leverage water production metrics in ESG reporting and sustainability commitments
- Position your organization as a leader in regenerative digital infrastructure
About Uravu Labs
Uravu Labs is pioneering atmospheric water generation technology that transforms waste heat into fresh water, addressing both water scarcity and cooling inefficiency. Our proprietary liquid desiccant systems extract water from air using low grade industrial waste heat-particularly from data centers-eliminating the need for groundwater extraction or municipal water supplies. Based in Bangalore, India, at the epicenter of the nation's water crisis, we are scaling our technology to transform data centers, manufacturing facilities, and other heat-intensive industries into water producers rather than water consumers. Our modular, containerized systems integrate seamlessly with existing infrastructure, delivering both economic returns through reduced cooling costs and environmental impact through carbon reduction and freshwater production. With proven technology now entering commercial deployment at scale, Uravu is building the foundation for water-positive industrial operations worldwide.
Contact: swapnil@uravulabs.com
This white paper is intended for informational purposes. Specific performance and economic results will vary based on site conditions, integration design, and operational parameters. Contact Uravu Labs for detailed technical and financial modeling for your facility.